library(StanHeaders)
library(ggplot2)
library(rstan)
rstan_options(auto_write = TRUE)
# 如果CPU和内存足够,设置成与马尔科夫链一样多
options(mc.cores = max(c(floor(parallel::detectCores() / 2), 1L)))

custom_colors <- c(
  "#4285f4", # GoogleBlue
  "#34A853", # GoogleGreen
  "#FBBC05", # GoogleYellow
  "#EA4335"  # GoogleRed
)
rstan_ggtheme_options(
  panel.background = element_rect(fill = "white"),
  legend.position = "top"
)
rstan_gg_options(
  fill = "#4285f4", color = "white",
  pt_color = "#EA4335", chain_colors = custom_colors
)34 分层正态模型
以分层正态模型介绍 rstan 包的用法
34.1 8schools 数据
分层正态模型
\[ \begin{aligned} y_j &\sim \mathcal{N}(\theta_j,\sigma_j) \quad \theta_j = \mu + \tau * \eta_j \\ \theta_j &\sim \mathcal{N}(\mu, \tau) \quad \eta_j \sim \mathcal{N}(0,1) \end{aligned} \]
34.1.1 拟合模型
用 rstan 包来拟合模型
# 编译模型
eight_schools_fit <- stan(
  model_name = "eight_schools",
  # file = "code/stan/8schools.stan",
  model_code = "
  // saved as 8schools.stan
  data {
    int<lower=0> J;         // number of schools
    real y[J];              // estimated treatment effects
    real<lower=0> sigma[J]; // standard error of effect estimates
  }
  parameters {
    real mu;                // population treatment effect
    real<lower=0> tau;      // standard deviation in treatment effects
    vector[J] eta;          // unscaled deviation from mu by school
  }
  transformed parameters {
    vector[J] theta = mu + tau * eta;        // school treatment effects
  }
  model {
    target += normal_lpdf(eta | 0, 1);       // prior log-density
    target += normal_lpdf(y | theta, sigma); // log-likelihood
  }
  ",
  data = list( # 观测数据
    J = 8,
    y = c(28, 8, -3, 7, -1, 1, 18, 12),
    sigma = c(15, 10, 16, 11, 9, 11, 10, 18)
  ),
  warmup = 1000, # 每条链预处理迭代次数
  iter = 2000,   # 每条链总迭代次数
  chains = 2,    # 马尔科夫链的数目
  cores = 2,     # 指定 CPU 核心数,可以给每条链分配一个
  verbose = FALSE, # 不显示迭代的中间过程
  refresh = 0,     # 不显示采样的进度
  seed = 20190425  # 设置随机数种子,不要使用 set.seed() 函数
)
#> Warning: There were 1 divergent transitions after warmup. See
#> https://mc-stan.org/misc/warnings.html#divergent-transitions-after-warmup
#> to find out why this is a problem and how to eliminate them.#> Warning: Examine the pairs() plot to diagnose sampling problems34.1.2 模型输出
#> Inference for Stan model: eight_schools.
#> 2 chains, each with iter=2000; warmup=1000; thin=1;
#> post-warmup draws per chain=1000, total post-warmup draws=2000.
#>
#>           mean se_mean  sd  2.5%   25%   50%   75% 97.5% n_eff Rhat
#> mu         8.2     0.2 5.1  -1.2   4.8   8.0  11.3  19.1   975    1
#> tau        6.6     0.2 5.8   0.3   2.5   5.3   9.2  20.7   784    1
#> eta[1]     0.4     0.0 0.9  -1.5  -0.2   0.4   1.0   2.2  1696    1
#> eta[2]    -0.1     0.0 0.8  -1.7  -0.6   0.0   0.5   1.7  1748    1
#> eta[3]    -0.2     0.0 0.9  -2.0  -0.8  -0.2   0.3   1.7  1921    1
#> eta[4]     0.0     0.0 0.9  -1.7  -0.7  -0.1   0.6   1.7  2035    1
#> eta[5]    -0.4     0.0 0.9  -2.0  -1.0  -0.4   0.2   1.4  1859    1
#> eta[6]    -0.2     0.0 0.9  -1.9  -0.8  -0.3   0.4   1.6  1885    1
#> eta[7]     0.3     0.0 0.8  -1.4  -0.2   0.3   0.9   2.0  1743    1
#> eta[8]     0.0     0.0 0.9  -1.7  -0.6   0.0   0.6   1.9  2118    1
#> theta[1]  11.4     0.2 8.2  -2.0   6.1  10.3  15.3  31.1  1194    1
#> theta[2]   7.8     0.1 6.2  -4.3   4.1   7.7  11.4  20.3  2314    1
#> theta[3]   6.0     0.2 7.5 -10.6   2.0   6.5  10.7  19.7  1698    1
#> theta[4]   7.7     0.1 6.6  -6.2   3.8   7.7  11.6  21.4  2052    1
#> theta[5]   5.2     0.1 6.4  -9.3   1.3   5.8   9.4  16.2  2025    1
#> theta[6]   6.2     0.1 6.6  -8.0   2.6   6.6  10.5  18.9  2106    1
#> theta[7]  10.5     0.2 6.5  -1.3   6.3  10.0  14.2  25.0  1566    1
#> theta[8]   8.2     0.2 7.7  -8.0   3.9   8.1  12.5  24.2  1764    1
#> lp__     -39.4     0.1 2.6 -44.8 -41.0 -39.2 -37.6 -34.8   752    1
#>
#> Samples were drawn using NUTS(diag_e) at Sun Oct  8 05:32:22 2023.
#> For each parameter, n_eff is a crude measure of effective sample size,
#> and Rhat is the potential scale reduction factor on split chains (at
#> convergence, Rhat=1).
提取任意一个参数的结果,如查看参数 \(\tau\) 的 95% 置信区间。
#> Inference for Stan model: eight_schools.
#> 2 chains, each with iter=2000; warmup=1000; thin=1;
#> post-warmup draws per chain=1000, total post-warmup draws=2000.
#>
#>     mean se_mean   sd 2.5% 97.5% n_eff Rhat
#> tau 6.65    0.21 5.76 0.27 20.73   784    1
#>
#> Samples were drawn using NUTS(diag_e) at Sun Oct  8 05:32:22 2023.
#> For each parameter, n_eff is a crude measure of effective sample size,
#> and Rhat is the potential scale reduction factor on split chains (at
#> convergence, Rhat=1).
从迭代抽样数据获得与 print(fit) 一样的结果。以便后续对原始采样数据做任意的进一步分析。rstan 包扩展泛型函数 summary() 以支持对 stanfit 数据对象汇总,输出各个参数分链条和合并链条的后验分布结果。
34.1.3 操作数据
合并四条马氏链的结果
返回的结果是一个列表
#> List of 5
#>  $ mu   : num [1:2000(1d)] 2.82 14.61 2.77 22.91 3.46 ...
#>   ..- attr(*, "dimnames")=List of 1
#>   .. ..$ iterations: NULL
#>  $ tau  : num [1:2000(1d)] 4.1789 9.9243 4.2404 14.278 0.0636 ...
#>   ..- attr(*, "dimnames")=List of 1
#>   .. ..$ iterations: NULL
#>  $ eta  : num [1:2000, 1:8] 0.552 0.519 0.929 -0.136 0.163 ...
#>   ..- attr(*, "dimnames")=List of 2
#>   .. ..$ iterations: NULL
#>   .. ..$           : NULL
#>  $ theta: num [1:2000, 1:8] 5.12 19.75 6.71 20.97 3.47 ...
#>   ..- attr(*, "dimnames")=List of 2
#>   .. ..$ iterations: NULL
#>   .. ..$           : NULL
#>  $ lp__ : num [1:2000(1d)] -43.2 -39.1 -39.3 -38.7 -43 ...
#>   ..- attr(*, "dimnames")=List of 1
#> .. ..$ iterations: NULL#> [1] "list"计算参数 \(\eta,\theta\) 的均值
#> [1]  0.37737234 -0.05115180 -0.22331030 -0.04388245 -0.35811384 -0.22323565
#> [7] 0.30601563 0.01891633#> [1] 11.436791 7.793837 6.010571 7.703675 5.161396 6.237395 10.528707
#> [8] 8.185503计算参数 \(\eta,\theta\) 的分位点
#>
#>             2.5%        25%         50%       75%    97.5%
#>   [1,] -1.507198 -0.1968247  0.37869013 0.9789101 2.174623
#>   [2,] -1.726116 -0.5851447 -0.04740783 0.4768830 1.660240
#>   [3,] -1.994936 -0.8202685 -0.23339301 0.3494418 1.662723
#>   [4,] -1.745175 -0.6545073 -0.05512642 0.5521324 1.741359
#>   [5,] -2.004906 -0.9575384 -0.35962354 0.2032693 1.407583
#>   [6,] -1.922606 -0.8169963 -0.25524392 0.3566269 1.574648
#>   [7,] -1.368122 -0.2396888  0.31536228 0.8581667 1.970735
#> [8,] -1.736231 -0.5953672 -0.03530469 0.6294982 1.886066#>
#> 2.5% 25% 50% 75% 97.5%
#> [1,] -2.033648 6.100229 10.271452 15.343849 31.06742
#> [2,] -4.273520 4.050181 7.722681 11.445376 20.34221
#> [3,] -10.641025 1.990698 6.517992 10.713881 19.70925
#> [4,] -6.152792 3.824841 7.651704 11.638808 21.40971
#> [5,] -9.289988 1.294042 5.751342 9.403381 16.21893
#> [6,] -8.003669 2.607037 6.582900 10.452106 18.90089
#> [7,] -1.262546 6.306058 9.995780 14.187053 25.04851
#> [8,] -7.978283 3.895587 8.129171 12.493753 24.21741计算参数 \(\mu,\tau\) 的均值
#> $mu
#> [1] 8.180393#> $tau
#> [1] 6.647675#> $lp__
#> [1] -39.38927计算参数 \(\mu,\tau\) 的分位点
#> $mu
#>      2.5%       25%       50%       75%     97.5%
#> -1.218135 4.824075 7.972065 11.343782 19.089152#> $tau
#> 2.5% 25% 50% 75% 97.5%
#> 0.2686822 2.4555350 5.3460596 9.1916895 20.7314381#> $lp__
#> 2.5% 25% 50% 75% 97.5%
#> -44.77153 -41.00192 -39.23531 -37.59843 -34.8090734.1.4 采样诊断
获取马尔科夫链迭代点列数据
eight_schools_sim 是一个三维数组,1000(次迭代)* 4 (条链)* 19(个参数)。如果 permuted = TRUE 则会合并四条马氏链的迭代结果,变成一个列表。
#> [1] "array"#> num [1:1000, 1:2, 1:19] 14.07 13.02 9.03 8.03 6.85 ...
#> - attr(*, "dimnames")=List of 3
#> ..$ iterations: NULL
#> ..$ chains : chr [1:2] "chain:1" "chain:2"
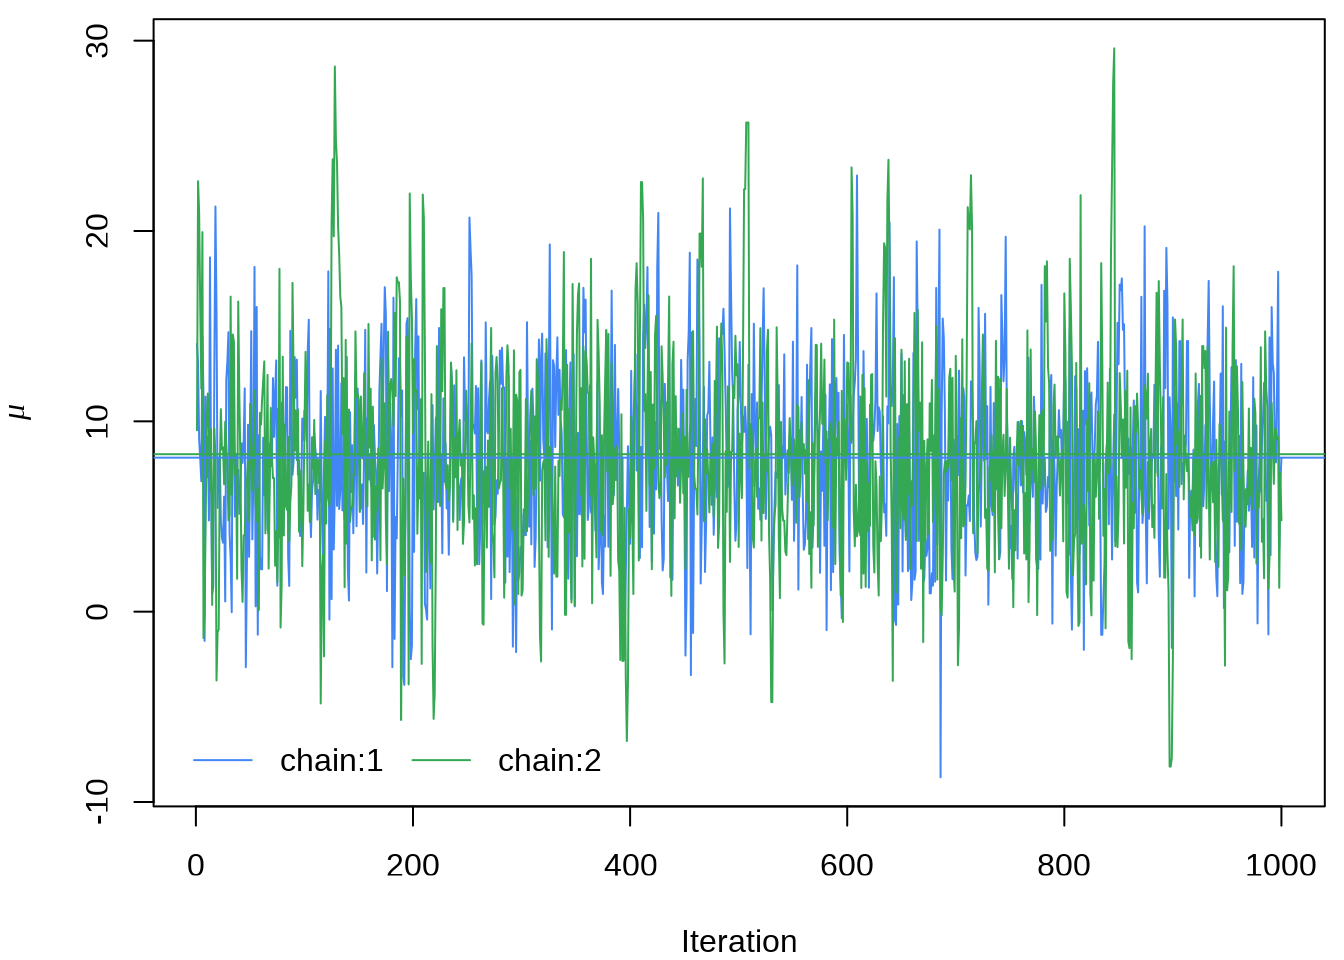
#> ..$ parameters: chr [1:19] "mu" "tau" "eta[1]" "eta[2]" ...提取参数 \(\mu\) 的四条迭代点列
matplot(eight_schools_mu_sim,
        xlab = "Iteration", ylab = expression(mu),
        type = "l", lty = "solid", col = custom_colors
)
abline(h = apply(eight_schools_mu_sim, 2, mean), col = custom_colors)
legend("bottomleft",
       legend = paste0("chain:", 1:2), box.col = "white", inset = 0.01,
       lty = "solid", horiz = TRUE, col = custom_colors
)
或者使用 rstan 提供的 traceplot 函数或者 stan_trace 函数,rstan 大量依赖 ggplot2 绘图,所以如果你熟悉 GGplot2 可以很方便地定制属于自己的风格,除了 rstan 提供的 rstan_ggtheme_options 和 rstan_gg_options 两个函数外,还可以使用 ggplot2 自带的大量配置选项和主题,如 theme_minimal 主题,因为 stan_trace等作图函数返回的是一个 ggplot 对象。
stan_trace(eight_schools_fit, pars = "mu") +
  theme_minimal() +
  labs(x = "Iteration", y = expression(mu))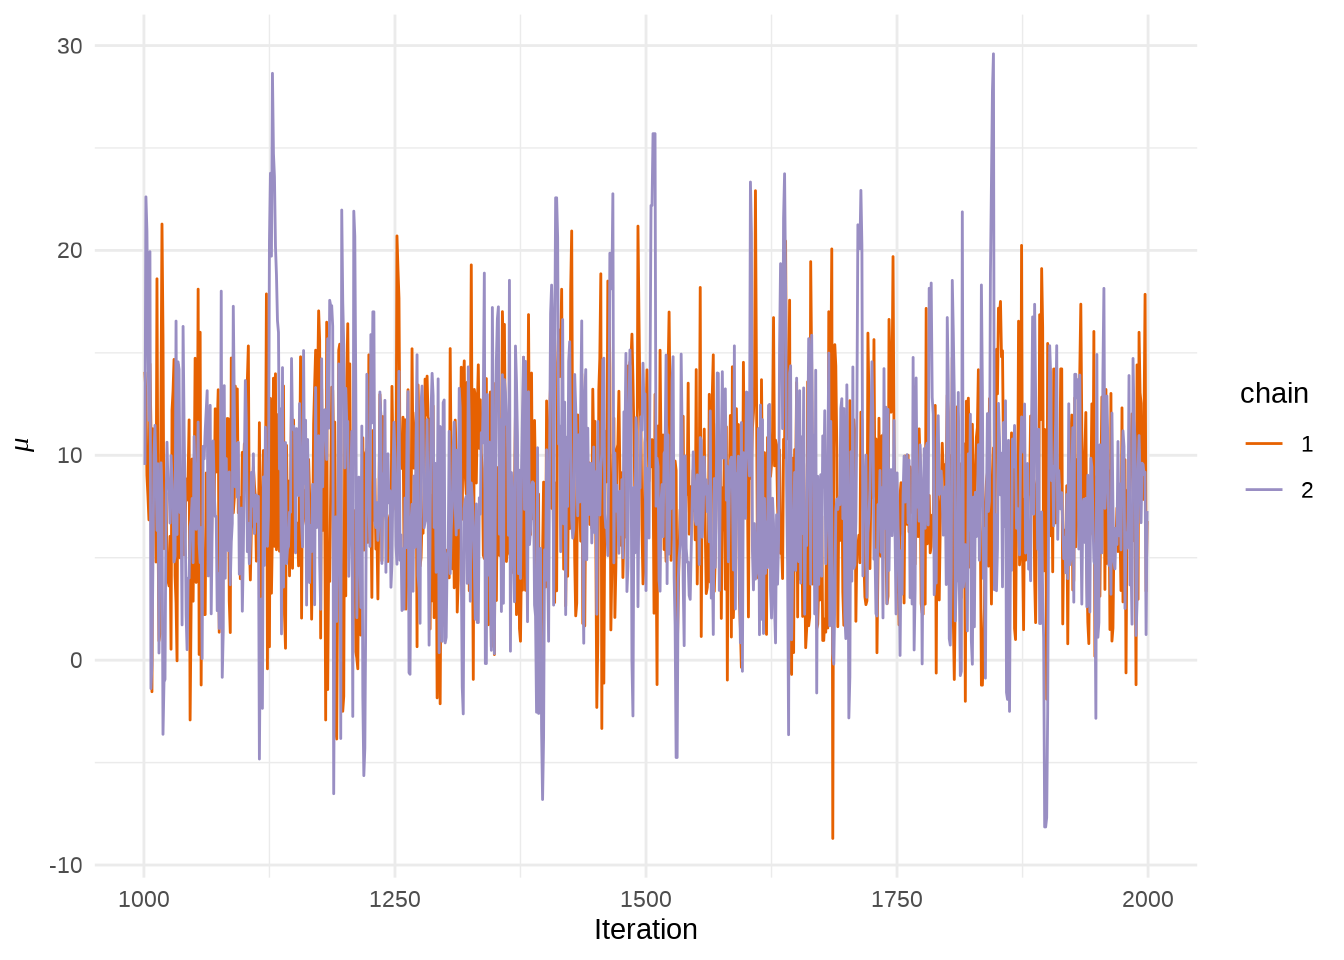
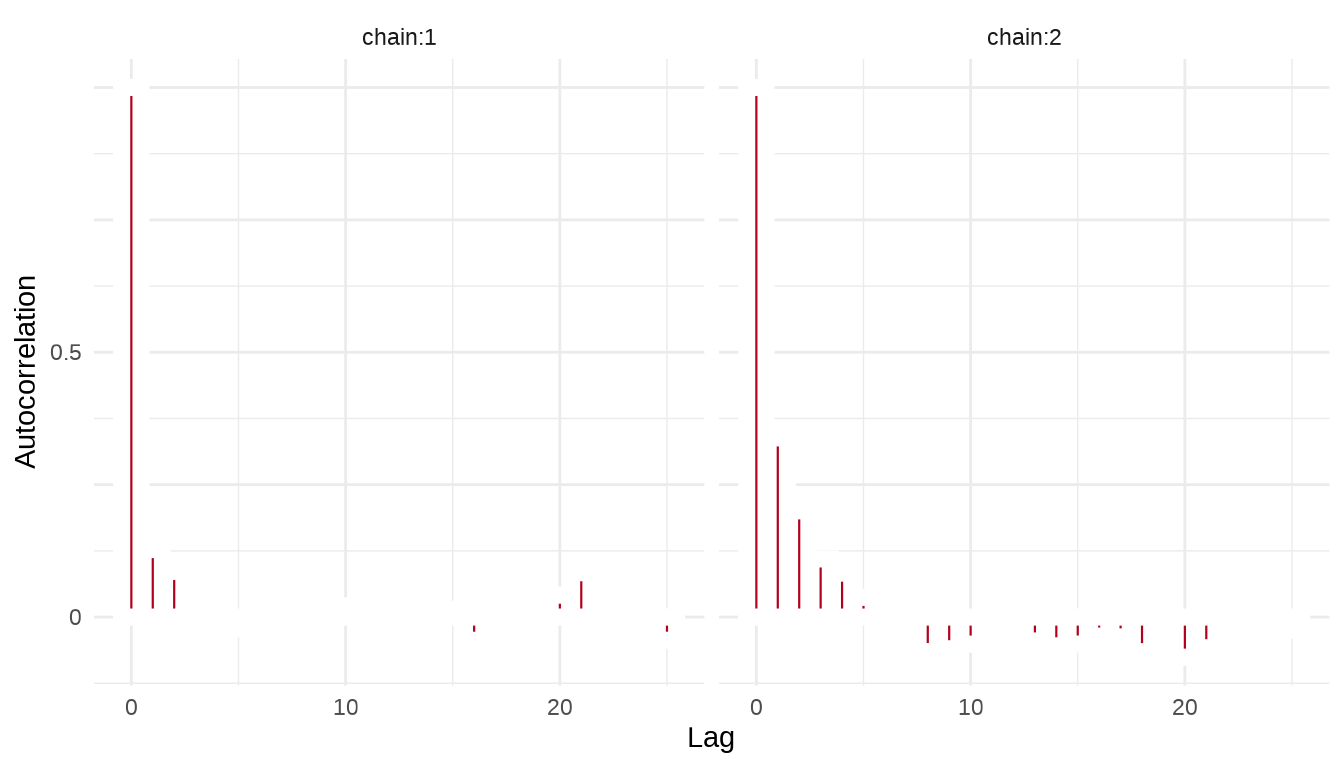
序列的自相关图,类似地,我们这里也使用 stan_ac 函数绘制自相关图
34.1.5 后验分布
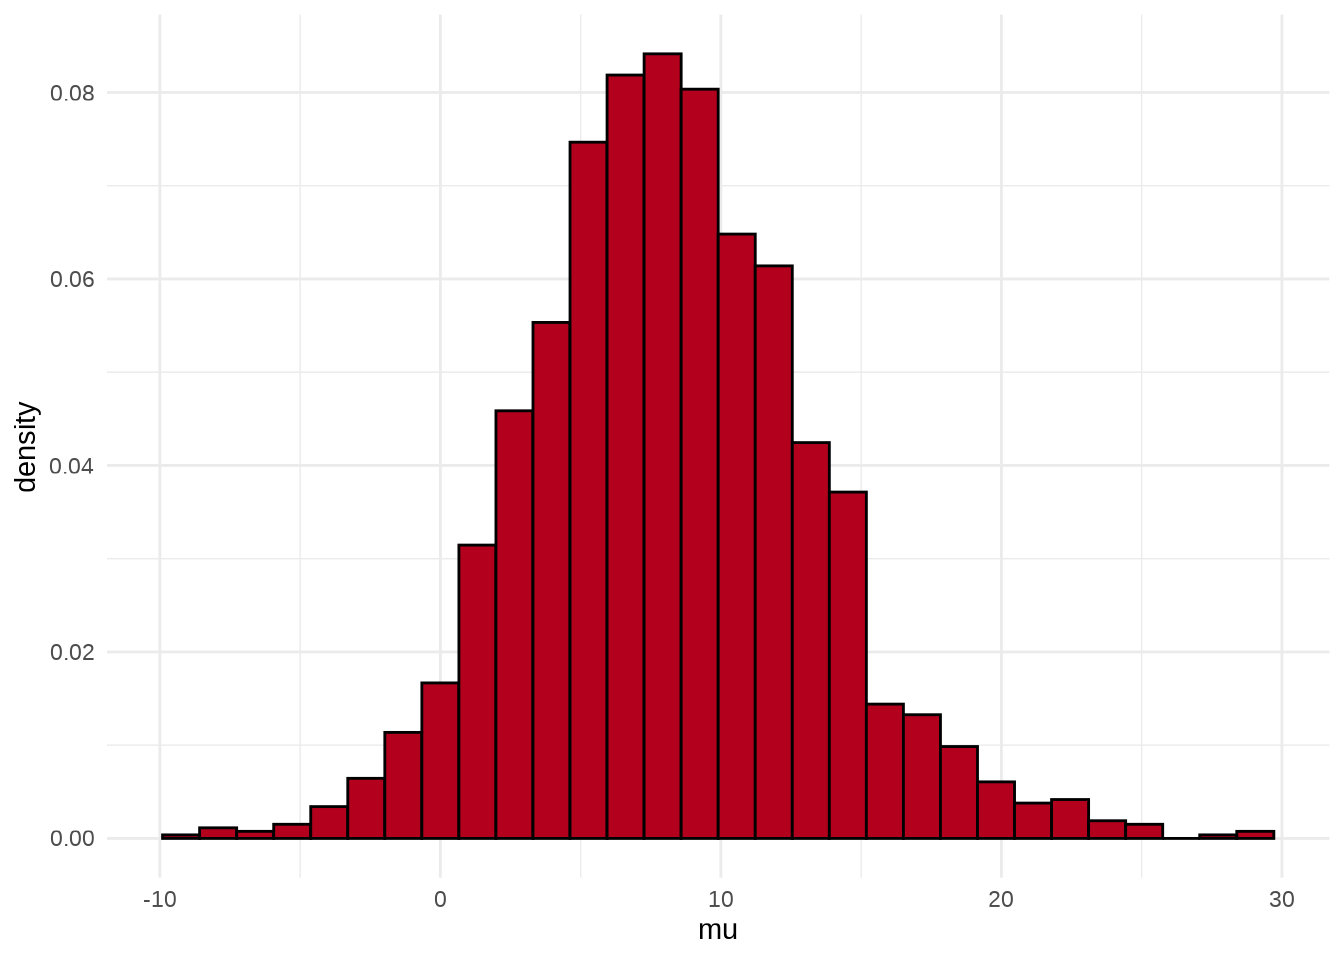
可以用 stan_hist 函数绘制参数 \(\mu\) 的后验分布图,它没有 separate_chains 参数,所以不能分链条绘制
参数 \(\mu\) 和 \(\tau\) 的散点图
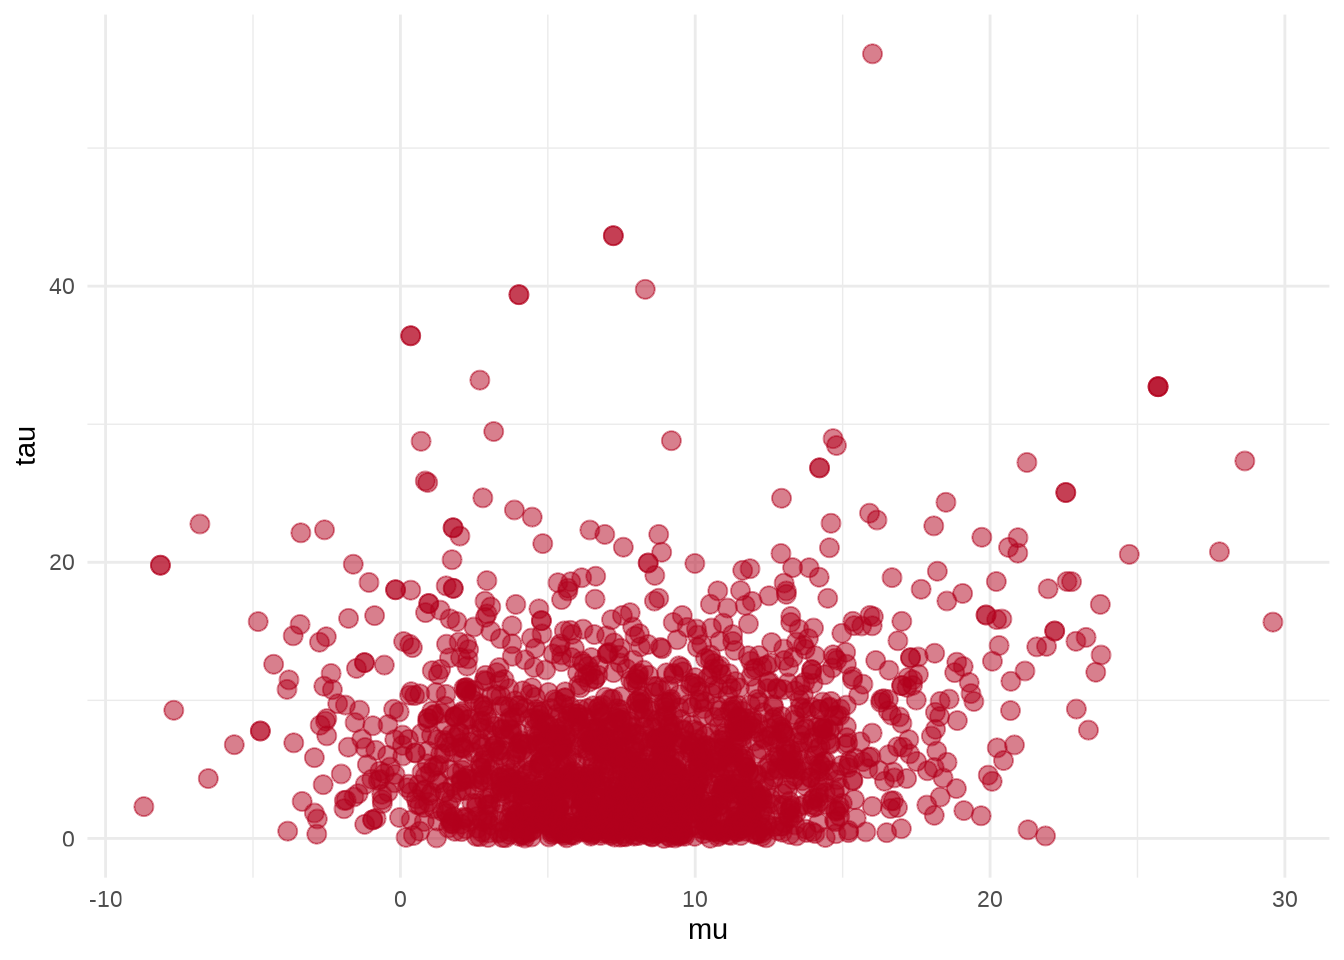
参数 \(\mu\) 的后验概率密度分布图
stan_dens(eight_schools_fit, pars = "mu", separate_chains = TRUE) +
  theme_minimal() +
  labs(x = expression(mu), y = "Density")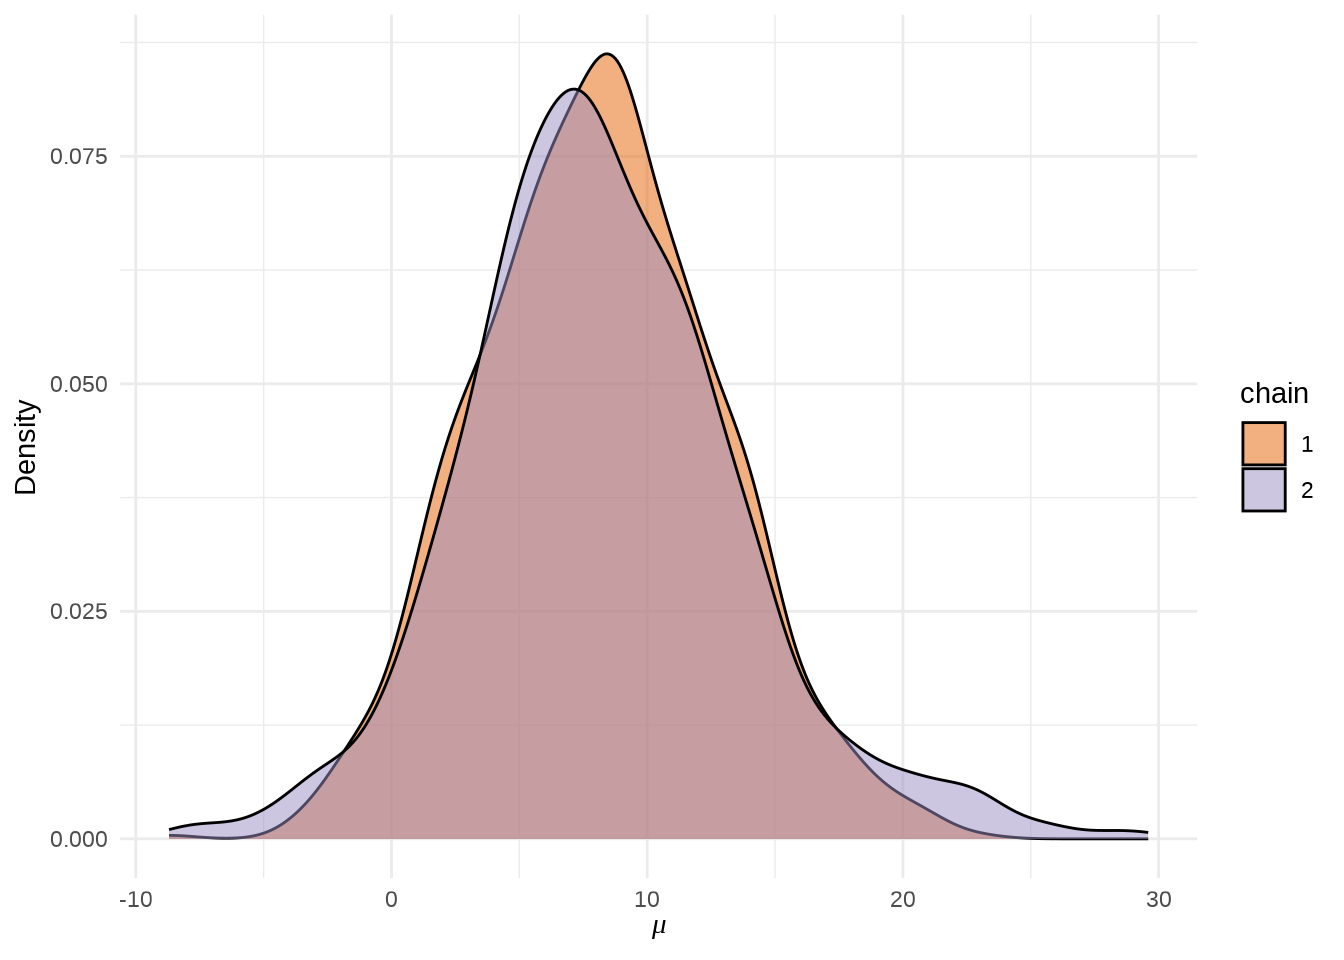
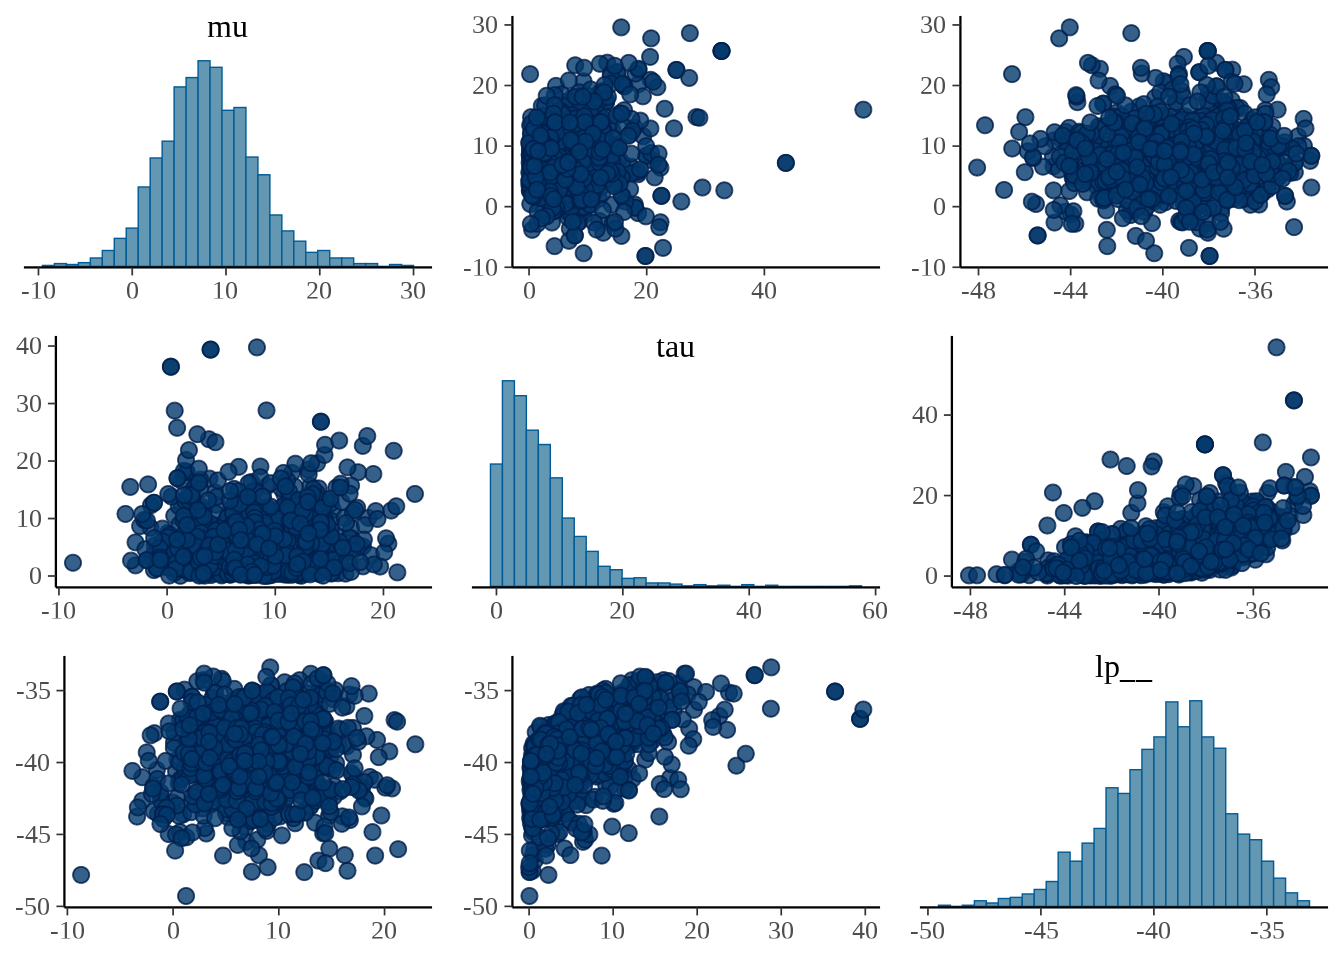
bayesplot 包的函数 mcmc_pairs() 以矩阵图展示多个参数的分布。
34.1.6 模型导出
rstan 包还支持从外部磁盘读取代码
34.1.7 其它 R 包
接下来,分别用 nlme 和 lme4 包拟合模型。
首先,调用 nlme 包的函数 lme() 拟合模型。
library(nlme)
fit_lme <- lme(y ~ 1, random = ~ 1 | g, weights = varFunc(~ 1/sigma^2))
summary(fit_lme)
#> Linear mixed-effects model fit by REML
#> Data: NULL
#> AIC BIC logLik
#> 60.7886 60.62633 -27.3943
#>
#> Random effects:
#> Formula: ~1 | g
#> (Intercept) Residual
#> StdDev: 10.44373 0.008057412
#>
#> Variance function:
#> Structure: fixed weights
#> Formula: ~1/sigma^2
#> Fixed effects: y ~ 1
#> Value Std.Error DF t-value p-value
#> (Intercept) 8.75 3.692415 8 2.369723 0.0453
#>
#> Standardized Within-Group Residuals:
#> Min Q1 Med Q3 Max
#> -8.002887e-05 -5.259764e-05 -8.646475e-06 2.708670e-05 9.480343e-05
#>
#> Number of Observations: 8
#> Number of Groups: 8接着,采用 lme4 包拟合模型,发现 lme4 包可以获得与 nlme 包一致的结果。
control <- lme4::lmerControl(
  check.conv.singular = "ignore",
  check.nobs.vs.nRE = "ignore",
  check.nobs.vs.nlev = "ignore"
)
fit_lme4 <- lme4::lmer(y ~ 1 + (1 | g), weights = 1 / sigma^2, control = control, REML = FALSE)
summary(fit_lme4)
#> Linear mixed model fit by maximum likelihood ['lmerMod']
#> Formula: y ~ 1 + (1 | g)
#> Weights: 1/sigma^2
#> Control: control
#>
#> AIC BIC logLik deviance df.resid
#> 64.4 64.6 -29.2 58.4 5
#>
#> Scaled residuals:
#> Min 1Q Median 3Q Max
#> -1.25814 -0.81193 -0.02014 0.57052 1.76556
#>
#> Random effects:
#> Groups Name Variance Std.Dev.
#> g (Intercept) 1.859e-13 4.311e-07
#> Residual 5.884e-01 7.671e-01
#> Number of obs: 8, groups: g, 8
#>
#> Fixed effects:
#> Estimate Std. Error t value
#> (Intercept) 7.686 3.123 2.461最后,使用 blme 包 (Chung 等 2013) ,blme 包基于 lme4 包,结果完全一致。
### Example using a residual variance prior ###
# This is the "eight schools" data set;
# the mode should be at the boundary of the space.

fit_blme <- blme::blmer(
  y ~ 1 + (1 | g),
  control = control, REML = FALSE,
  resid.prior = point, cov.prior = NULL,
  weights = 1 / sigma^2
)
summary(fit_blme)
#> Resid prior: point(value = 1)
#> Prior dev : 0
#>
#> Linear mixed model fit by maximum likelihood ['blmerMod']
#> Formula: y ~ 1 + (1 | g)
#> Weights: 1/sigma^2
#> Control: control
#>
#> AIC BIC logLik deviance df.resid
#> 65.3 65.6 -29.7 59.3 5
#>
#> Scaled residuals:
#> Min 1Q Median 3Q Max
#> -0.96507 -0.62280 -0.01545 0.43763 1.35429
#>
#> Random effects:
#> Groups Name Variance Std.Dev.
#> g (Intercept) 0 0
#> Residual 1 1
#> Number of obs: 8, groups: g, 8
#>
#> Fixed effects:
#> Estimate Std. Error t value
#> (Intercept) 7.686 4.072 1.88734.2 rats 数据
rats 数据最早来自 Gelfand 等 (1990) ,记录 30 只小鼠每隔一周的重量,一共进行了 5 周。第一次记录是小鼠第 8 天的时候,第二次测量记录是第 15 天的时候,一直持续到第 36 天。下面在 R 环境中准备数据。
# 总共 30 只老鼠
N <- 30
# 总共进行 5 周
T <- 5
# 小鼠重量
y <- structure(c(
  151, 145, 147, 155, 135, 159, 141, 159, 177, 134,
  160, 143, 154, 171, 163, 160, 142, 156, 157, 152, 154, 139, 146,
  157, 132, 160, 169, 157, 137, 153, 199, 199, 214, 200, 188, 210,
  189, 201, 236, 182, 208, 188, 200, 221, 216, 207, 187, 203, 212,
  203, 205, 190, 191, 211, 185, 207, 216, 205, 180, 200, 246, 249,
  263, 237, 230, 252, 231, 248, 285, 220, 261, 220, 244, 270, 242,
  248, 234, 243, 259, 246, 253, 225, 229, 250, 237, 257, 261, 248,
  219, 244, 283, 293, 312, 272, 280, 298, 275, 297, 350, 260, 313,
  273, 289, 326, 281, 288, 280, 283, 307, 286, 298, 267, 272, 285,
  286, 303, 295, 289, 258, 286, 320, 354, 328, 297, 323, 331, 305,
  338, 376, 296, 352, 314, 325, 358, 312, 324, 316, 317, 336, 321,
  334, 302, 302, 323, 331, 345, 333, 316, 291, 324
), .Dim = c(30, 5))
# 第几天
x <- c(8.0, 15.0, 22.0, 29.0, 36.0)
xbar <- 22.0
重复测量的小鼠重量数据 rats 如下 表格 34.1 所示。
| 第 8 天 | 第 15 天 | 第 22 天 | 第 29 天 | 第 36 天 | |
|---|---|---|---|---|---|
| 1 | 151 | 199 | 246 | 283 | 320 |
| 2 | 145 | 199 | 249 | 293 | 354 |
| 3 | 147 | 214 | 263 | 312 | 328 |
| 4 | 155 | 200 | 237 | 272 | 297 |
| 5 | 135 | 188 | 230 | 280 | 323 |
| 6 | 159 | 210 | 252 | 298 | 331 |
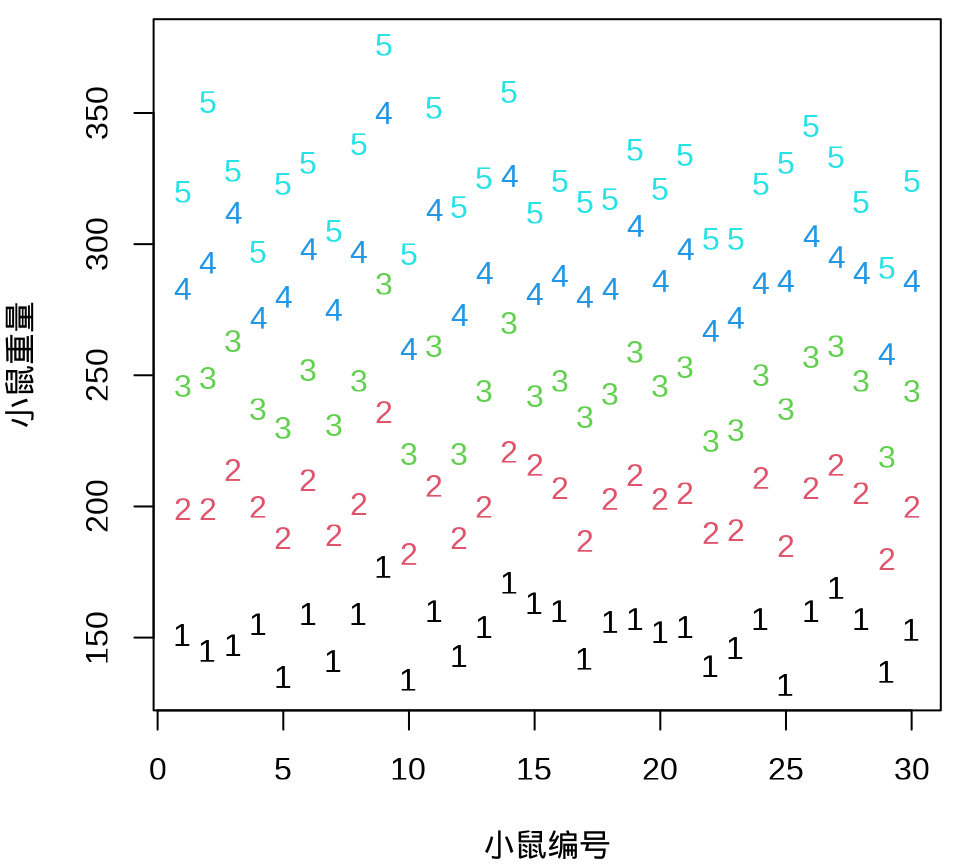
小鼠重量数据的分布情况见下 图 34.8 ,由图可以假定 30 只小鼠的重量服从正态分布。
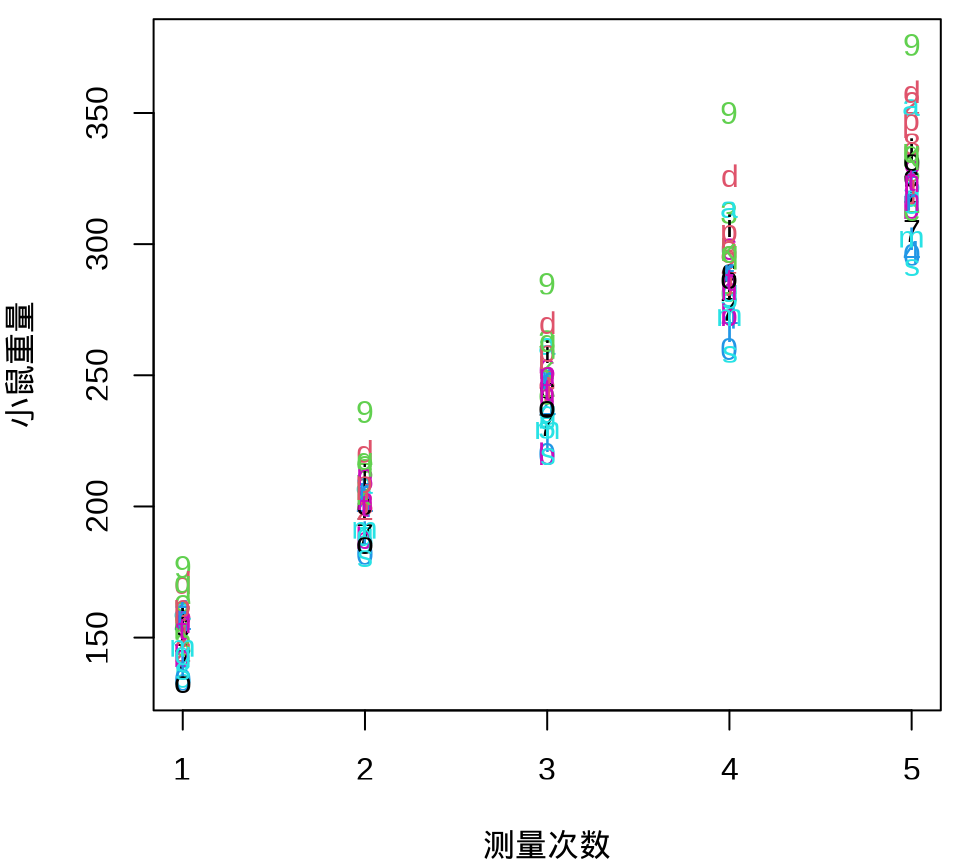
由 图 34.9 可见, 30 只小鼠的重量增长趋势呈现一种线性趋势。
34.2.1 rstan
初始化模型参数,设置采样算法的参数。
接下来,基于重复测量数据,建立线性生长曲线模型:
\[ \begin{aligned} \alpha_c &\sim \mathcal{N}(0,100) \quad \beta_c \sim \mathcal{N}(0,100) \\ \tau^2_c &\sim \mathrm{inv\_gamma}(0.001, 0.001) \\ \tau^2_{\alpha} &\sim \mathrm{inv\_gamma}(0.001, 0.001) \\ \tau^2_{\beta} &\sim \mathrm{inv\_gamma}(0.001, 0.001) \\ \alpha &\sim \mathcal{N}(\alpha_c, \tau_{\alpha}) \quad \beta \sim \mathcal{N}(\beta_c, \tau_{\beta}) \\ y_{nt} &\sim \mathcal{N}(\alpha_n + \beta_n * (x_t - \bar{x}), \tau_c) \\ & n = 1,2,\ldots,N \quad t = 1,2,\ldots,T \end{aligned} \]
其中, \(\alpha_c,\beta_c,\tau_c,\tau_{\alpha},\tau_{\beta}\) 为无信息先验,\(N = 30\) 和 \(T = 5\) 分别表示实验中的小鼠数量和测量次数,下面采用 Stan 编码、编译、采样和拟合模型。
rats_fit <- stan(
  model_name = "rats",
  model_code = "
  data {
    int<lower=0> N;
    int<lower=0> T;
    vector[T] x;
    matrix[N,T] y;
    real xbar;
  }
  parameters {
    vector[N] alpha;
    vector[N] beta;

    real alpha_c;
    real beta_c;          // beta.c in original bugs model

    real<lower=0> tausq_c;
    real<lower=0> tausq_alpha;
    real<lower=0> tausq_beta;
  }
  transformed parameters {
    real<lower=0> tau_c;       // sigma in original bugs model
    real<lower=0> tau_alpha;
    real<lower=0> tau_beta;

    tau_c = sqrt(tausq_c);
    tau_alpha = sqrt(tausq_alpha);
    tau_beta = sqrt(tausq_beta);
  }
  model {
    alpha_c ~ normal(0, 100);
    beta_c ~ normal(0, 100);
    tausq_c ~ inv_gamma(0.001, 0.001);
    tausq_alpha ~ inv_gamma(0.001, 0.001);
    tausq_beta ~ inv_gamma(0.001, 0.001);
    alpha ~ normal(alpha_c, tau_alpha); // vectorized
    beta ~ normal(beta_c, tau_beta);  // vectorized
    for (n in 1:N)
      for (t in 1:T)
        y[n,t] ~ normal(alpha[n] + beta[n] * (x[t] - xbar), tau_c);
  }
  generated quantities {
    real alpha0;
    alpha0 = alpha_c - xbar * beta_c;
  }
  ",
  data = list(N = N, T = T, y = y, x = x, xbar = xbar),
  chains = chains, init = init, iter = iter,
  verbose = FALSE, refresh = 0, seed = 20190425
)
模型输出结果如下:
#> Inference for Stan model: rats.
#> 4 chains, each with iter=1000; warmup=500; thin=1;
#> post-warmup draws per chain=500, total post-warmup draws=2000.
#>
#>               mean se_mean   sd   2.5%    25%    50%    75%  97.5% n_eff Rhat
#> alpha_c      242.5     0.1  2.6  237.3  240.8  242.5  244.2  247.6  2200    1
#> beta_c         6.2     0.0  0.1    6.0    6.1    6.2    6.3    6.4  2134    1
#> tausq_c       37.3     0.2  5.4   28.3   33.4   36.8   40.5   49.0  1090    1
#> tausq_alpha  218.5     1.5 62.1  127.3  174.5  207.2  252.1  369.2  1787    1
#> tausq_beta     0.3     0.0  0.1    0.1    0.2    0.3    0.3    0.5  1340    1
#> tau_c          6.1     0.0  0.4    5.3    5.8    6.1    6.4    7.0  1096    1
#> tau_alpha     14.6     0.0  2.0   11.3   13.2   14.4   15.9   19.2  1871    1
#> tau_beta       0.5     0.0  0.1    0.4    0.5    0.5    0.6    0.7  1304    1
#> alpha0       106.4     0.1  3.5   99.4  104.0  106.4  108.7  113.4  2300    1
#> lp__        -438.6     0.3  6.6 -452.7 -442.9 -438.1 -434.1 -426.3   703    1
#>
#> Samples were drawn using NUTS(diag_e) at Sun Oct  8 05:34:02 2023.
#> For each parameter, n_eff is a crude measure of effective sample size,
#> and Rhat is the potential scale reduction factor on split chains (at
#> convergence, Rhat=1).
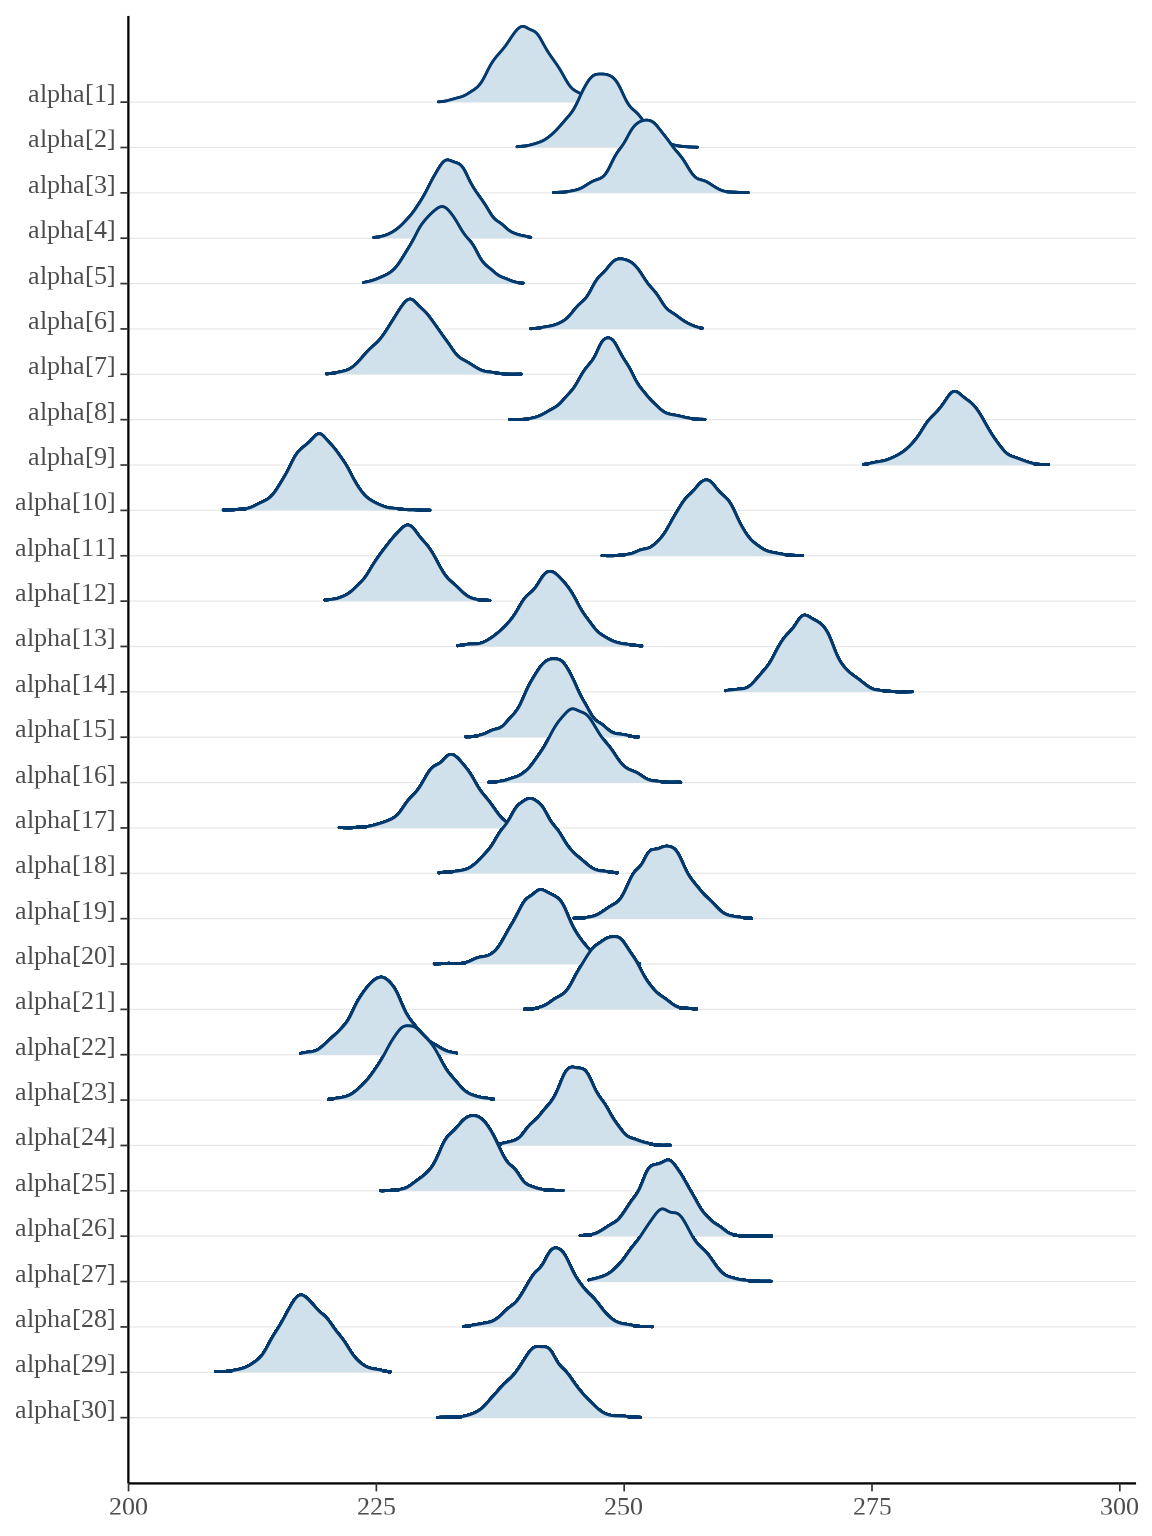
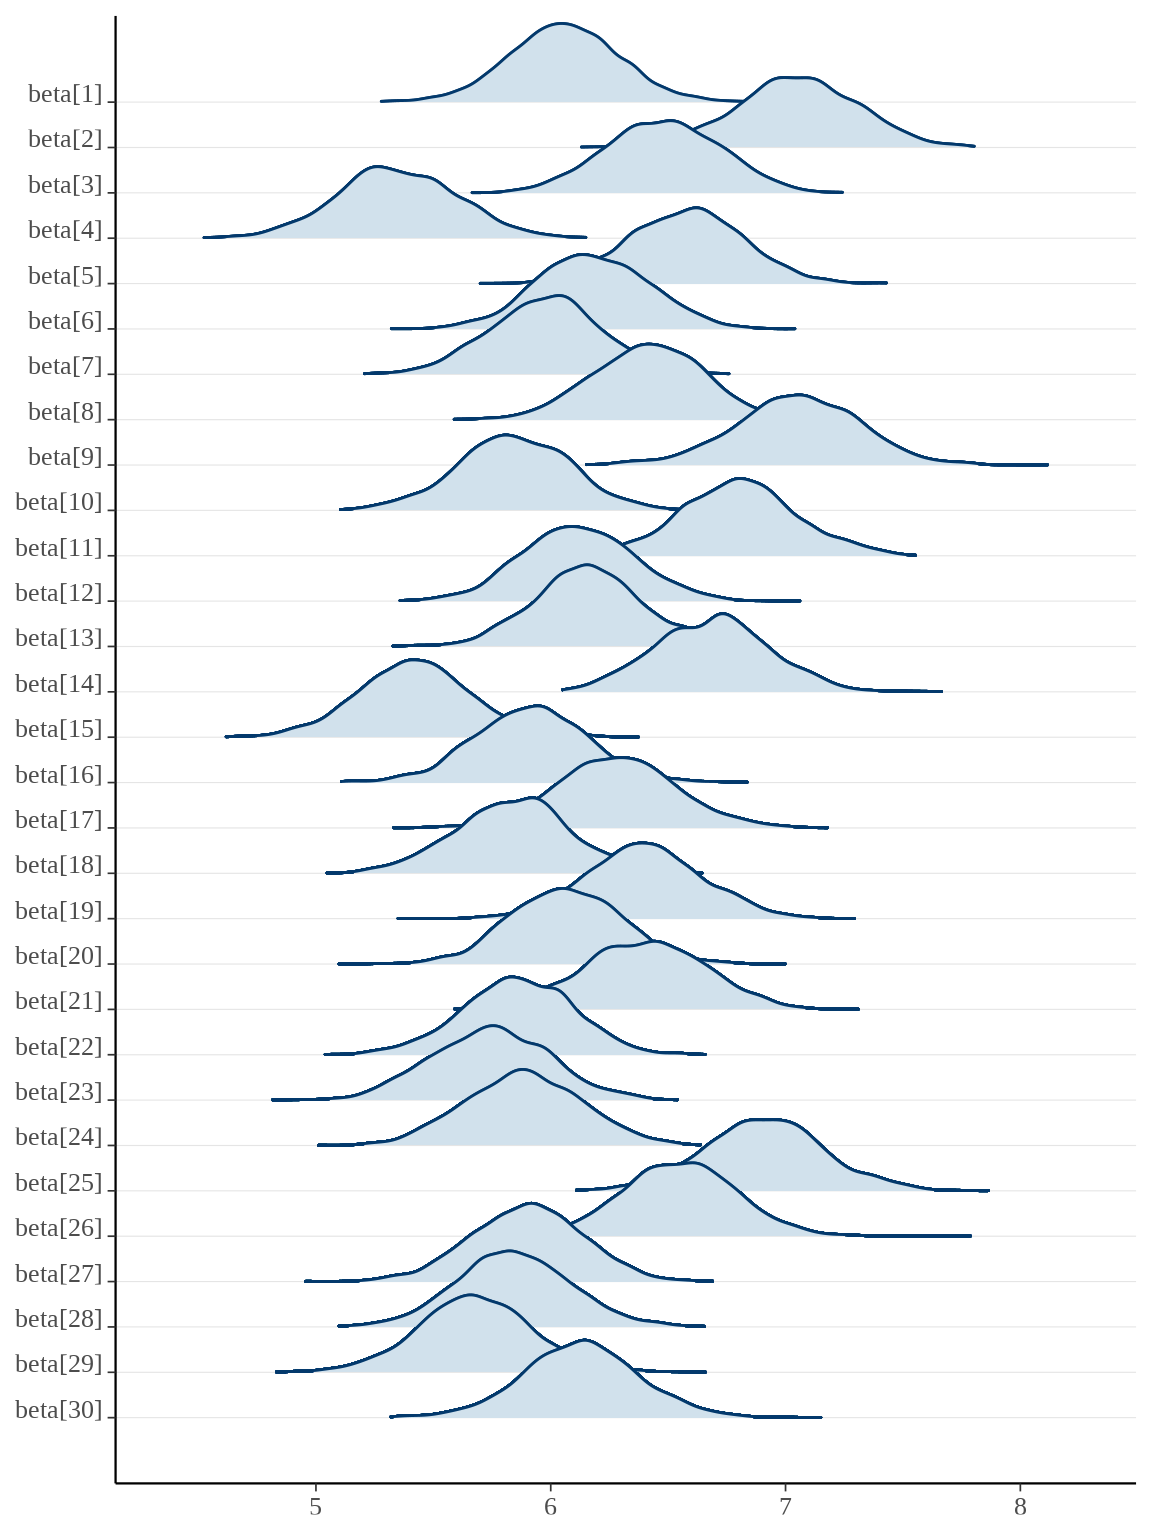
对于分量众多的参数向量,比较适合用岭线图展示后验分布,下面调用 bayesplot 包绘制参数向量 \(\alpha,\beta\) 的后验分布。
34.2.2 nlme
nlme 包适合将长格式的数据,因此,先将小鼠数据整理成长格式。
weight <- c(
  151, 145, 147, 155, 135, 159, 141, 159, 177, 134,
  160, 143, 154, 171, 163, 160, 142, 156, 157, 152, 154, 139, 146,
  157, 132, 160, 169, 157, 137, 153, 199, 199, 214, 200, 188, 210,
  189, 201, 236, 182, 208, 188, 200, 221, 216, 207, 187, 203, 212,
  203, 205, 190, 191, 211, 185, 207, 216, 205, 180, 200, 246, 249,
  263, 237, 230, 252, 231, 248, 285, 220, 261, 220, 244, 270, 242,
  248, 234, 243, 259, 246, 253, 225, 229, 250, 237, 257, 261, 248,
  219, 244, 283, 293, 312, 272, 280, 298, 275, 297, 350, 260, 313,
  273, 289, 326, 281, 288, 280, 283, 307, 286, 298, 267, 272, 285,
  286, 303, 295, 289, 258, 286, 320, 354, 328, 297, 323, 331, 305,
  338, 376, 296, 352, 314, 325, 358, 312, 324, 316, 317, 336, 321,
  334, 302, 302, 323, 331, 345, 333, 316, 291, 324
)
rats <- rep(1:30, each = 5)
days <- rep(c(8, 15, 22, 29, 36), each = 30)
rats_data <- data.frame(weight = weight, rats = rats, days = days)
小鼠的重量随时间增长,不同小鼠的情况又会有所不同。可用随机效应模型表示生长曲线模型,下面加载 nlme 包调用函数 lme() 拟合该模型。
library(nlme)
rats_lme <- lme(data = rats_data, fixed = weight ~ days, random = ~ 1 | rats)
summary(rats_lme)
#> Linear mixed-effects model fit by REML
#> Data: rats_data
#> AIC BIC logLik
#> 1265.735 1277.724 -628.8675
#>
#> Random effects:
#> Formula: ~1 | rats
#> (Intercept) Residual
#> StdDev: 0.0008249919 16.13226
#>
#> Fixed effects: weight ~ days
#> Value Std.Error DF t-value p-value
#> (Intercept) 106.56762 3.209948 120 33.19917 0
#> days 6.18571 0.133057 28 46.48933 0
#> Correlation:
#> (Intr)
#> days -0.912
#>
#> Standardized Within-Group Residuals:
#> Min Q1 Med Q3 Max
#> -2.37123210 -0.69911675 0.01219089 0.47399847 3.97009878
#>
#> Number of Observations: 150
#> Number of Groups: 30模型输出结果中,固定效应中的截距项 (Intercept) 对应 106.56762,斜率 days 对应 6.18571。Stan 模型中截距参数 alpha0 的后验估计是 106.332,斜率参数 beta_c 的后验估计是 6.188。对比 Stan 和 nlme 包的拟合结果,可以发现贝叶斯和频率方法的结果是非常接近的。
34.2.3 lme4
当采用 lme4 包拟合数据的时候,发现参数取值落在参数空间的边界上,除此之外,输出结果与 nlme 包几乎相同。
#> boundary (singular) fit: see help('isSingular')#> Linear mixed model fit by REML ['lmerMod']
#> Formula: weight ~ days + (1 | rats)
#> Data: rats_data
#>
#> REML criterion at convergence: 1257.7
#>
#> Scaled residuals:
#> Min 1Q Median 3Q Max
#> -2.3712 -0.6991 0.0122 0.4740 3.9701
#>
#> Random effects:
#> Groups Name Variance Std.Dev.
#> rats (Intercept) 0.0 0.00
#> Residual 260.2 16.13
#> Number of obs: 150, groups: rats, 30
#>
#> Fixed effects:
#> Estimate Std. Error t value
#> (Intercept) 106.5676 3.2099 33.20
#> days 6.1857 0.1331 46.49
#>
#> Correlation of Fixed Effects:
#> (Intr)
#> days -0.912
#> optimizer (nloptwrap) convergence code: 0 (OK)
#> boundary (singular) fit: see help('isSingular')lme4 包依赖 nloptr 包提供数值优化求解器,也做了更多的矩阵奇异性检查,对于复杂的重复测量模型,往往会发生奇异,需要适当降低复杂性,更多详情见 lme4 包的帮助文档 help('isSingular') 。
34.2.4 blme
blme 包基于 lme4 包
control <- lme4::lmerControl(
  check.conv.singular = "ignore",
  check.nobs.vs.nRE = "ignore",
  check.nobs.vs.nlev = "ignore"
)
rats_blme <- blme::blmer(
  weight ~ days + (1 | rats),
  data = rats_data,
  resid.prior = point, cov.prior = NULL,
  control = control, REML = FALSE
)
summary(rats_blme)
#> Resid prior: point(value = 1)
#> Prior dev : 0
#>
#> Linear mixed model fit by maximum likelihood ['blmerMod']
#> Formula: weight ~ days + (1 | rats)
#> Data: rats_data
#> Control: control
#>
#> AIC BIC logLik deviance df.resid
#> 34567.8 34579.9 -17279.9 34559.8 146
#>
#> Scaled residuals:
#> Min 1Q Median 3Q Max
#> -35.932 -9.417 0.478 8.745 54.068
#>
#> Random effects:
#> Groups Name Variance Std.Dev.
#> rats (Intercept) 29.22 5.405
#> Residual 1.00 1.000
#> Number of obs: 150, groups: rats, 30
#>
#> Fixed effects:
#> Estimate Std. Error t value
#> (Intercept) 106.568 2.413 44.16
#> days 6.186 0.100 61.84
#>
#> Correlation of Fixed Effects:
#> (Intr)
#> days -0.912